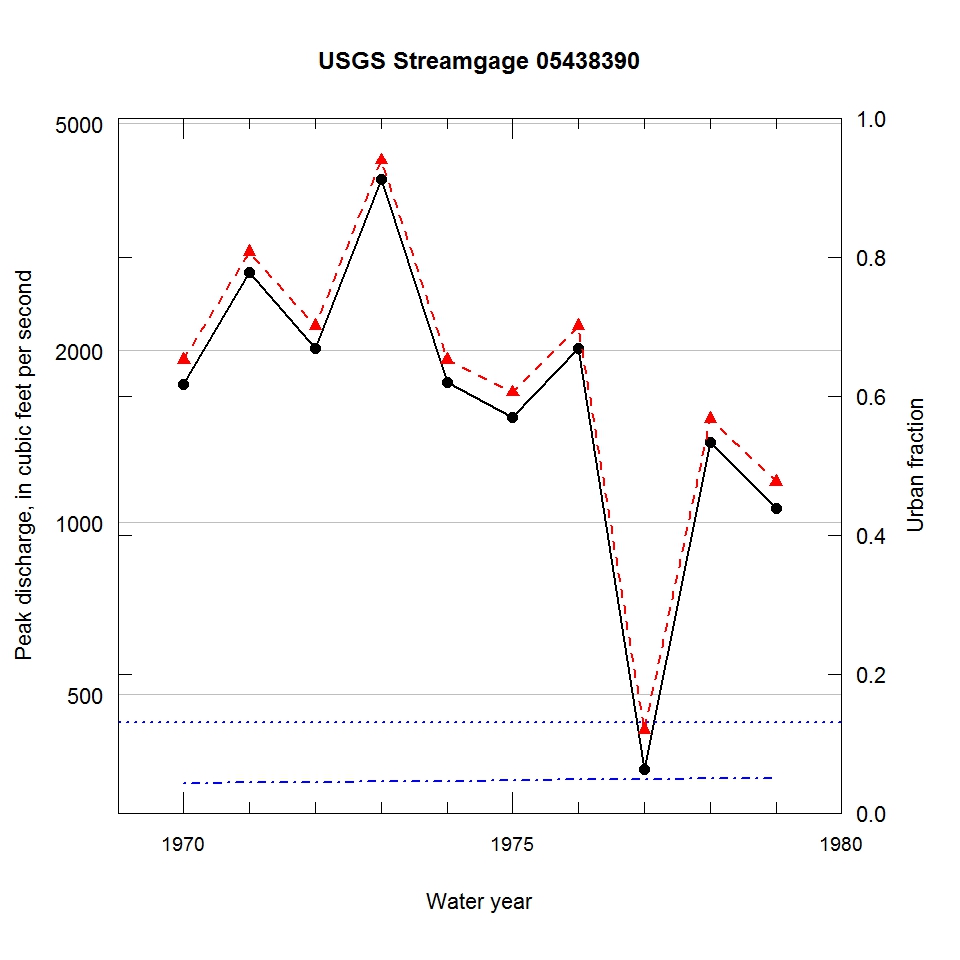
Observed and urbanization-adjusted annual maximum peak discharge and associated urban fraction and precipitation values at USGS streamgage:
05438390 PISCASAW CREEK BELOW MOKELER CREEK NR CAPRON, IL


| Water year | Segment | Discharge code | Cumulative reservoir storage (acre-feet) | Urban fraction | Precipitation (inches) | Observed peak discharge (ft3/s) | Adjusted peak discharge (ft3/s) | Exceedance probability |
| 1970 | 1 | -- | 0 | 0.043 | 0.988 | 1750 | 1930 | 0.493 |
| 1971 | 1 | -- | 0 | 0.044 | 0.477 | 2750 | 2980 | 0.202 |
| 1972 | 1 | -- | 0 | 0.044 | 1.203 | 2020 | 2210 | 0.394 |
| 1973 | 1 | -- | 0 | 0.045 | 1.795 | 4000 | 4310 | 0.070 |
| 1974 | 1 | -- | 0 | 0.046 | 0.587 | 1760 | 1930 | 0.492 |
| 1975 | 1 | -- | 0 | 0.047 | 0.032 | 1530 | 1690 | 0.599 |
| 1976 | 1 | -- | 0 | 0.048 | 1.221 | 2020 | 2210 | 0.396 |
| 1977 | 1 | -- | 0 | 0.049 | 0.791 | 370 | 433 | 0.969 |
| 1978 | 1 | -- | 0 | 0.050 | 1.398 | 1380 | 1520 | 0.659 |
| 1979 | 1 | -- | 0 | 0.050 | 0.302 | 1060 | 1180 | 0.787 |

